TradingView is the favorite charting software for many of the traders here at ASFX, and receives over 10 million visitors each month. The software can be used to analyze forex pairs, cryptocurrencies, stocks, and commodities in real-time.
The number of features TradingView has to offer can seem endless and overwhelming. This article will give you a quick breakdown of the menus from the 4 toolbars at your disposal, and by the end you will know what each menu controls and which menus you’ll be more likely to use in your own trading.
Account
You can save or change the current layout, change your profile settings, get help, and check out new updates. Not a button I press often, if ever.
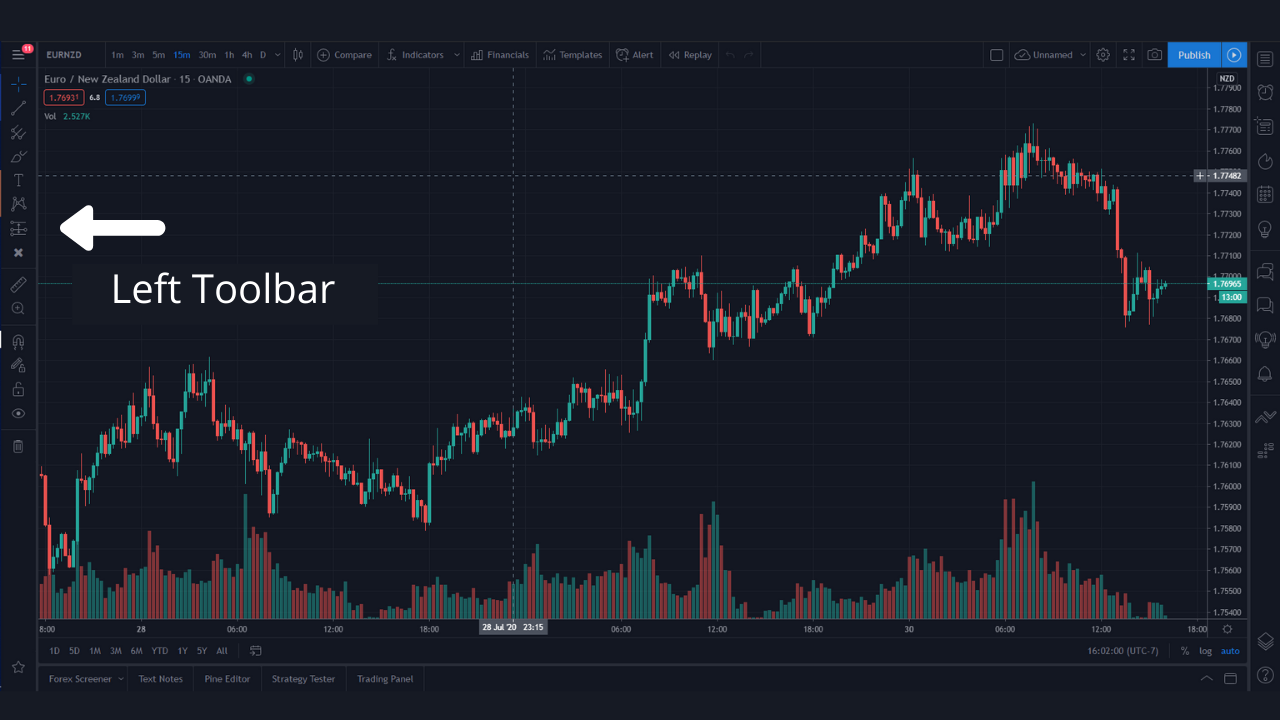
Cursors
Can choose the style of your cursor. I like to use the cross hair. You will also find the eraser tool in this menu, which is good for deleting multiple drawings without clearing the entire chart.
Trendline Tools
Contains dozens of drawing tools to help you identify trend using straight lines. There are simple lines where you choose both points, rays that extend all the way across the chart, and different types of channels.
Gann and Fibonacci Tools
This is where you will find all things pitchfork, Gann, and Fibonacci. I most often see traders using the Fib retracement tool from this menu.
Geometric Shapes
Super useful for drawing support and resistance zones and for highlighting entries or market observations. Also contains the curved line and brush tools. The brush tool is great for forecasting possible and probable setups.
Annotation Tools
This is where you’ll find all of the different text formatting as well as your larger arrows. My favorite tools from this menu are the text and note. The text allows me to track my current analysis, and the I find the note tool helpful in keeping my charts clean during backtesting sessions.
Patterns
This is where you will find tools that can help you label market structure according to Elliott wave theory. Depending on your trading style and analysis, this menu could be your bread and butter.
Prediction and Measurement Tools
At ASFX we react to the market instead of trying to predict it. However, if forecasting helps you in your analysis you may find more of these tools useful. The tools we use most from this section are the long position and short position. These allow us to easily see the potential risk to reward ratio for trade ideas. I also like to use the bars tool to study price action sequences in isolation.
Icons
These are a bunch of different symbols you can use on your chart, ranging from airplanes to smiley faces. I honestly haven’t seen a trader with an airplane symbol on their chart. I have found the arrows, crosses, checkmarks, and circles to be most useful from this section.
Measurement Tool
This is one of my favorite tools overall. It gives you the distance between 2 points in time, number of bars, and change in price in percentage and pips.
Zoom Tool
Allows you to highlight a specific section of price and zoom in on it. This is useful when you need high levels of precision in your drawings.
Magnet Mode
This connects your drawing to specific open, close, high, and low values. There are two types of magnets: the strong magnet and the weak magnet. The strong magnet snaps your drawings to the nearest OHLC value, while the weak magnet allows for a little more discretion. This can be useful when drawing trendlines, static support and resistance, or using the fib retracement tool.
Stay in Drawing Mode
Instead of repeatedly clicking the drawing tool you would like to use, you can stay in the drawing mode for that tool until you want to use a different tool. This can save you a bit of time when doing your analysis.
Lock All Drawing Tools
Locks all of your drawings into place. This prevents you from accidentally moving any of your drawings while scrolling or marking up your chart.
Hide All Drawing Tools
Quickly hides all of your drawings if you need to take a look at a cleaner chart. All of your drawings come back when a new drawing is placed on the chart.
Replicate New Drawing
All new drawings will be replicated on all charts in the layout when the same ticker is selected. This feature shines brightest for traders who use multi-time frame analysis simultaneously, like watching the 15 minute chart for a bias and the 1 minute chart for the entry (as taught in the ASFX Advanced Divergence Course).
Remove Drawings
Deletes all of the drawings on the chart. This makes it easy to quickly change back to a fresh chart. This is how I clear my charts on the weekends to prepare for a new trading week.
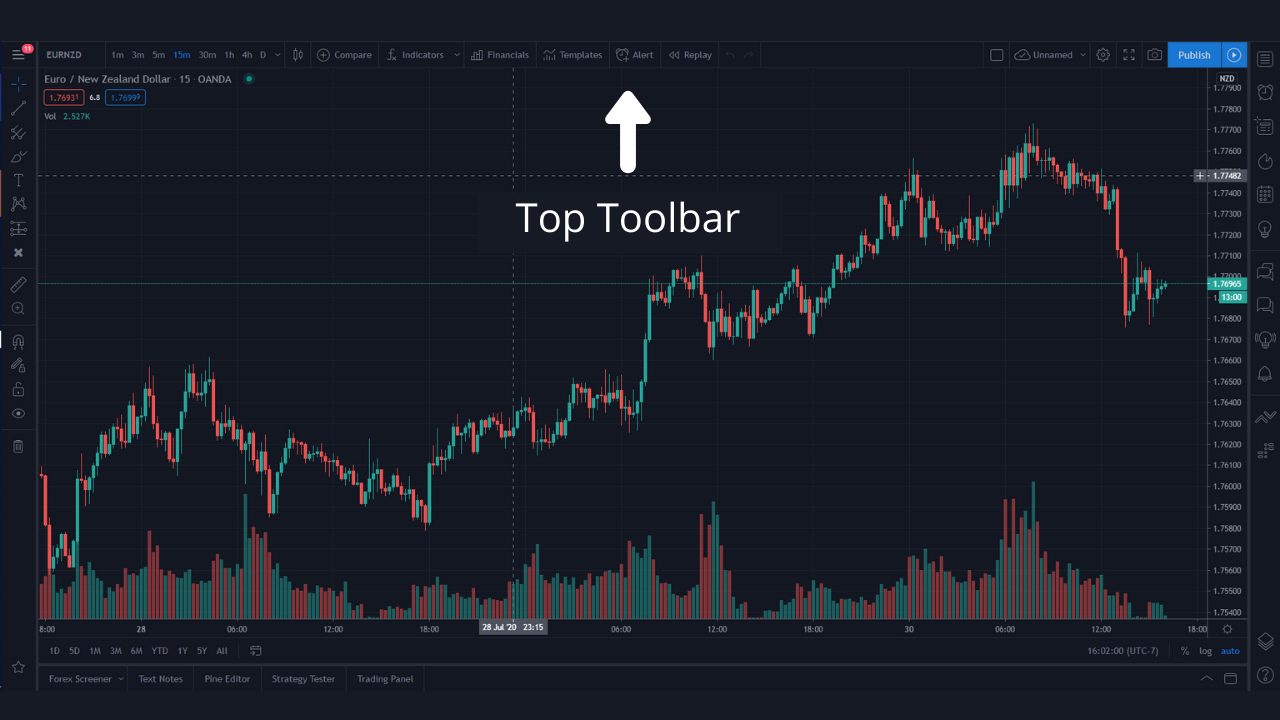
Symbol/Ticker
You can search for forex pairs, stocks, indices, commodities, and cryptocurrencies. If your broker is listed on TradingView you can choose to only look at the pairs offered from that broker.
Time Interval
Use this toolbar to switch between time frames. You can make your most-used time frames more accessible by starring your favorites. This creates a shortcut in the toolbar to quickly choose between those intervals. You can switch intervals even faster by simply typing in the number followed by the interval you want to see (for months use M, for minutes just type in the number and hit enter).
Chart Style
Choose the charting style for prices, such as line or Heikin Ashi candles. Many traders choose to use candles because of how easy they are to read and the amount of data that is communicated by each candle (OHLC values). Some traders also use line charts to help them find clean support and resistance levels.
Compare or Add Symbol
You can place more than 1 pair on a chart. I find this useful when I am studying the behavioral correlations between pairs, such as the DXY and EURUSD or AUDUSD and EURAUD. You can compare between any symbol available on the platform. Each symbol will have its own price axis that will be labeled.
Indicators and Strategies
Many of the commonly used indicators, such as moving averages, relative strength index, and MACD can be found here. You’ll also find indicators (and strategies) made by other people in the trading community. A really cool new feature is Candlestick Patterns. There are many to choose from, such as bearish and bullish engulfing and the evening star. Hovering over the callout provides you with a detailed explanation of the pattern. This can help you develop your eye for candlestick patterns. This feature definitely still needs some tweaks, but can be very helpful for beginners.
Financials
Forex traders are unlikely to find this section helpful. It is used by stock traders and investors to help them value a company.
Templates
This menu is to save different indicator templates. Its great if you have multiple strategies you trade that use different groups of indicators. There are also some default templates you can try, I personally have never used these.
Alert
Set alerts that can be sent to you through the TradingView app, email, or text message. This is useful because it allows you to be aware when price has hit certain levels so you can look at the charts if you need to enter, manage, or exit a position.
Replay Tool
An excellent tool to manually backtest your trading strategy. On the free plans you can only rewind on the daily chart, you have to upgrade to the paid version to backtest the intraday charts, such as the 1 hour or 15 minute.
Undo/Redo
Allows you to quickly undo or redo the drawing or drag you made on the chart.
Select Layout
This menu allows you to view more than 1 chart in the window. Only available on the paid plans, you can select from 1 to 8 different charts. I find it most useful for multi-time frame analysis being performed in real time, but you can also use it to monitor multiple pairs at once.
Manage Chart Layout
Save changes you have made to your chart with the different drawing tools. You can create multiple layouts for different purposes, whether it be for different strategies or for sharing with different groups.
Chart Properties
This is where you can change your settings. There are 6 sub menus to help you design a chart layout that fits your needs and personality. You can choose the colors of your candles, background, choose what labels are displayed, and so much more.
Full Screen Mode
Allows your chart to fill the entire screen. I prefer to do my analysis and trading in full screen mode, as it allows me to fall more into the flow of the chart and increases my level of focus.
Snapshot
Captures a screenshot of the current chart layout. This is an excellent tool for sharing ideas or for saving images into your electronic trading journal. You can copy the image link or choose to save the image which automatically opens the link. You can then right-click on the image to save it to your computer or copy it. There’s also a button to easily share to Twitter.
Publish
Published ideas can be shared with the TradingView community by publishing a public idea, or you can keep them to yourself and publish it as a private idea. Private publishing also gives you the opportunity to share with select individuals via a private link.
Record Video Idea
A recent update to the TradingView platform gives you the ability to record video of your trade ideas instead of just showing the chart and some text. Be aware that you need to have a microphone for your computer or laptop to use this feature.
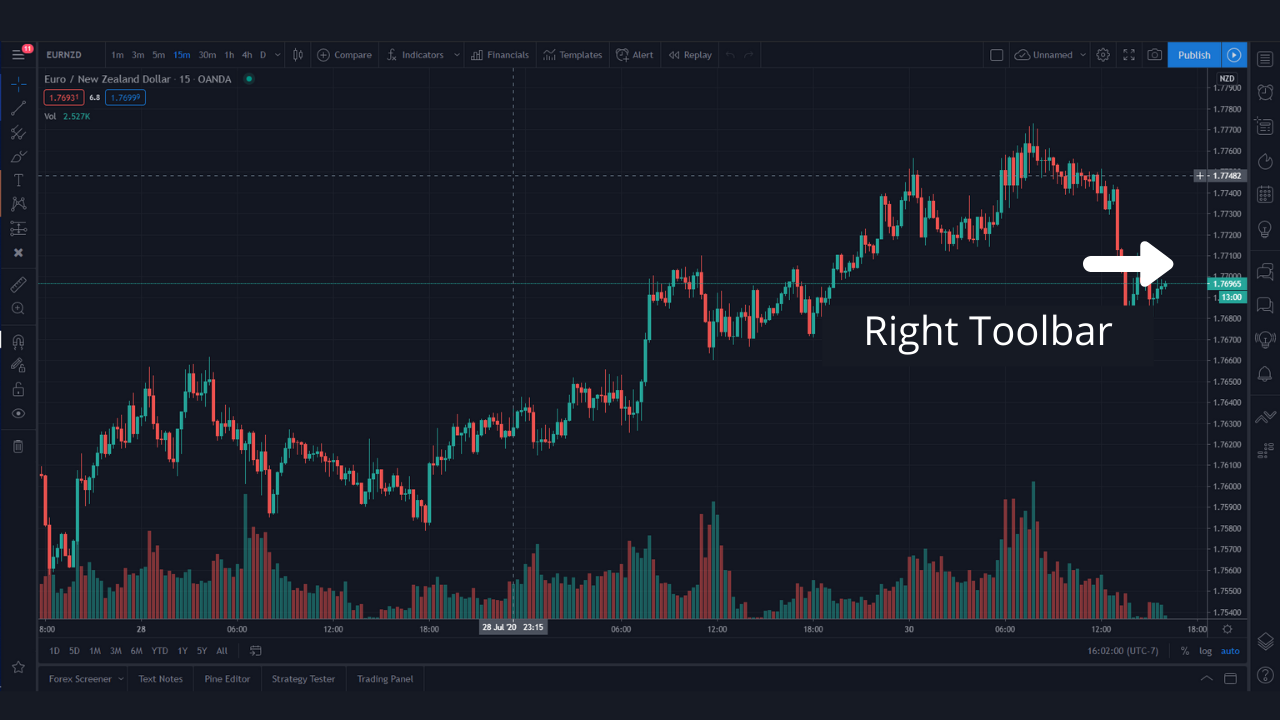
Watchlist, Details, and News
The section of this menu I use the most is the watchlist. You can create custom watchlists of your favorite pairs to trade, and you can flag pairs with different colors to draw more attention to them. This will generate watchlists based on the flag color as well. Make sure your daily watchlist is catered to your trading strategy.
The details section gives you an overview of the pair, It displays the 52 week range for the pair, its performance over a number of time periods, and some other data you can find on other parts of your chart.
The news section gives you summaries of different news events and gives you the link to read the full article.
You can choose the height of each of these windows by using the arrow to drag them up and down. You can only drag the news section as far as the details section.
Alerts
This is your log of past and active alerts. You can also use this window to set an alert on the pair that you currently have open on your chart.
Data Window
Displays the hard data points of the pair such as open and close, as well as the price positions of any indicators you have included.
Hot Lists
Another section for stock traders to help them find potential movers to trade.
Calendar
Gives you the news events for the day with a brief explanation of what the numbers or announcement means.
My Ideas
This is the hub of all of your published ideas, including video ideas. You can also use the plus button at the top to publish an idea without using the publish button.
Public Chats
These are forums that are not monitored, so be sure to enter at your own risk. For the most part I wouldn’t suggest following the trade ideas shared in these chats, it is a lot of the blind leading the blind. But you may be able to make some connections to other traders so you don’t feel so alone in your journey.
Private Chats
All of your private messages are stored here. You can change your chat settings and start new chats.
Ideas Stream
If you choose to follow trade ideas for pairs they will show up here. Not all ideas are created equal, again I advise using extreme caution if you choose to follow the ideas posted here. Stick to people with good ratings.
Notifications
List of notifications for such as likes and comments on published ideas, new followers, and a place to change your settings.
Order Panel
If your broker is integrated with TradingView you can place your buy and sell orders directly through the platform. Simply choose your broker and login with your details. I like using TradingView for my entries because it calculates my position size effortlessly. I believe this feature is not available for traders operating within Europe.
DOM
Depth of market, also known as the order book. It lets you see the number of open orders at different price levels. This is broker-dependent, if your broker is listed you can easily see their order book here without switching to the broker platform.
Object Tree
Displays all of the objects on your chart, including those that are hidden. You can quickly remove, hide, or lock drawings from this menu without having to click on them individually, saving you time when completing your analysis.
Help
Brings up a menu to find help and support. You can find answers to frequently asked questions and a number of articles on all things about TradingView, from billing to social networking.
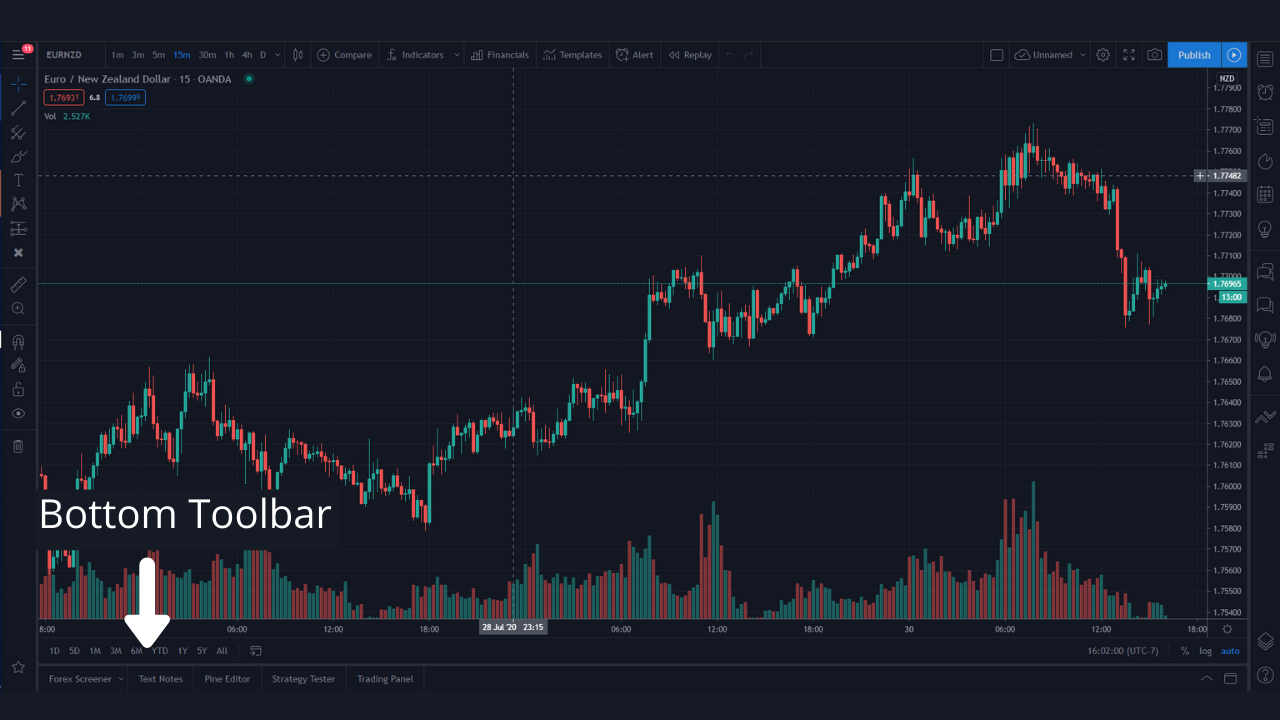
Forex Screener
Allows you to quickly scan pairs for opportunities based on factors such as moving averages rating, percent change over the day, weekly performance, and a volatility rating. This could potentially help you choose the best pairs for your strategy. If you are looking for a long-term hold, seeing the 6 month and yearly performance could help you make better trading decisions.
Text Notes
This allows you to create notes while you trade if you don’t want to include them on the chart, or perhaps you are keeping notes for multiple pairs. You can save your notes and access them at any time. You could also use this as your trading journal instead of having to switch back and forth between windows when you are taking your notes.
Pine Editor
TradingView has designed its own cloud based script so you can create custom indicators to be used on their servers.
Strategy Tester
You can test the accuracy and precision of strategies from the public library or strategies you have coded yourself. It generates data such as profitability factor, number of closed trades, and strike rate.
Trading Panel
This is only an accessible feature if your broker is connected to TradingView. The trading panel shows your current positions, pending orders, account summary, transaction history, and another notifications log. If you aren’t sure what broker to choose when starting out you can always demo trade using TradingView’s paper trading for live practice,
The ASFX Way
Many of the traders within our community have similar style chart layouts consisting of black or white candles, a solid background, and the indicators that help us identify high probability trade ideas. Check out this video from Austin where he goes over how to change these settings as well as the indicators needed for the ASFX system, with links in the description of the video so you can include them on your own chart.
To summarize, you can use the drawing tools on the left toolbar to help you see and analyze price movements. The top toolbar allows you to choose pairs, time frames, customize your layout, and share ideas. The right toolbar contains your watchlists, calendar, chats, and different data to help you track the pairs you are most interested in. The bottom toolbar can help you identify the best pairs to trade with the screener. test strategies that have been coded with Pine Editor, and check and manage the status of positions in your trading account. Now you should have a better understanding of how to navigate and use the features of TradingView. Happy trading!